James P Houghton

James Houghton - Candle Oscillation 2


Candle Oscillation 2

22 Aug 2012

In the last post, we described a candle with a long-period oscillation, and developed a hypothesis about a causal structure that might be leading to that oscillation, in the form of a causal loop diagram:
In this post, we'll start to build up a model based upon that hypothesis, and see if it is capable of producing such behavior, and if so, under what conditions. We'll start with a very basic sketch, one that doesn't attempt to include all the dynamics, but allows us to test out the B1 'Wicking' loop.
For the time being, we'll set 'Combustion' equal to about 1.5 milligrams per second, and guess at a wick capacity of 15 milligrams. It's hard to measure wick capacity, so we'll eventually do a sensitivity analysis to determine how important the variable is, and how much effort to put into that measurement  For now we'll guess that the wax present in the wick, if you stopped the 'wicking' process, would burn for 10 seconds. Pretty reasonable. For now we'll assume that the rate of wicking is simply proportional to the difference between the wax in the wick and the wick capacity. We'll set the characteristic recharge time to 1 second.
In summary:
Simulation Settings
·         Time Start: 0
·         Time Length: 10
·         Time Step: 0.1
·         Time Units: Seconds
·         Algorithm: RK1
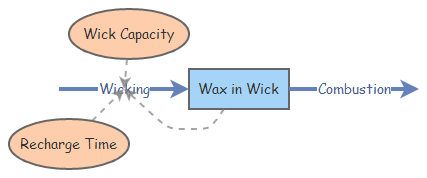
Recharge Time
·         Value: 1
·         Units: Seconds
Wick Capacity
·         Value: 15
·         Units: Milligrams
Wax in Wick
·         Initial Value: 15
·         Non-Negative: false
·         Units: Milligrams
Combustion
·         Rate: 1.5
·         Alpha: Wax in Wick
·         Omega: None
·         Positive Only: true
·         Units: Milligrams per Second
Wicking
·         Rate: ([Wick Capacity]-[Wax in Wick])/[Recharge Time]
·         Units: Milligrams per Second

When we run the simulation, we see expected behavior for a candle burning in steady state - the amount of wax in the wick declines from its maximum to a steady state where the burn rate and the wick rate are equal.
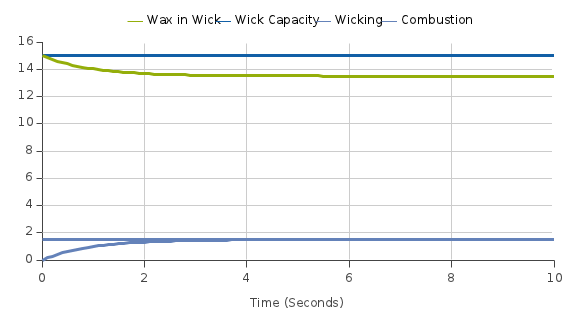
(Not sure what's going on with the chart colors, bummer.)

In the next post we'll build up loops R1 and R2.

Some more candle references:
http://www.nrc.gov/reading-rm/doc-collections/nuregs/staff/sr1805/ch3-6.pdf


© 2016 James P. Houghton