You can use it too by including the project code: MzfyV3-6hnRz74zg_T_ocF9ABNozjJE6d into your projects.
Alternately, to use the interpolate functions in Google spreadsheets, visit the script gallery under the Tools menu:
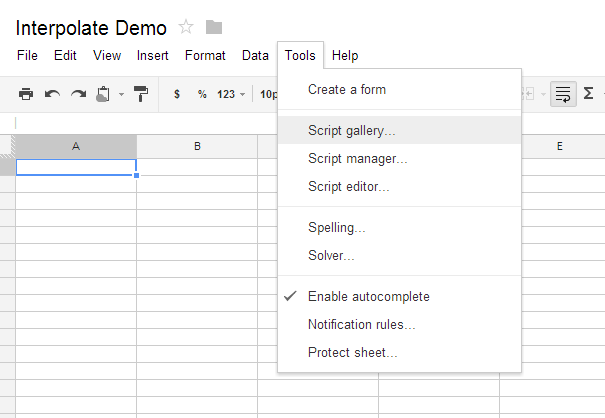
and search for "Interpolate":

Interpolate over X-Y values:
interp(xstr, ystr, xvalstr)
Performs linear interpolation on the data set with x values listed as strings (because this is how Google spreadsheets passes them to the function) in the first argument, and y values (as strings) in second argument. For example, in the following spreadsheet, xstr = A2:A21 and ystr = B2:B21:
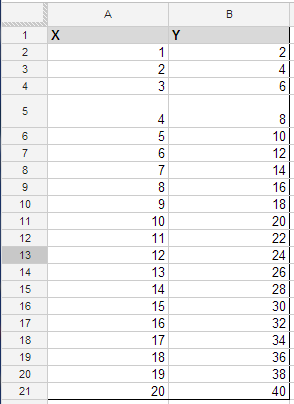

my call to the interpolate function would be:
=interp(A2:A21,B2:B21,E4)
Interpolate over time series data
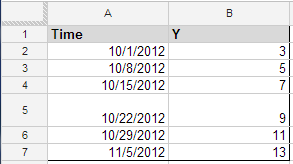
interpdate(tstr, ystr, tvalstr)
When you have data in which the independent variable is formatted as a date/time string, you need to use a different method than when interpolating purely over numeric data. Use interpdate if your data is akin to the following:
Here's a link to a google spreadsheet demonstrating both functions in action. Happy computing!